
 Français
  Deutsch
  Español
  Italiano
  Nederlands
  Português
  Brasileiro
  Ελληνικά
  Polski
  Română
  Svenska
  Türkçe
  Български
  हिंदी
हिंदी 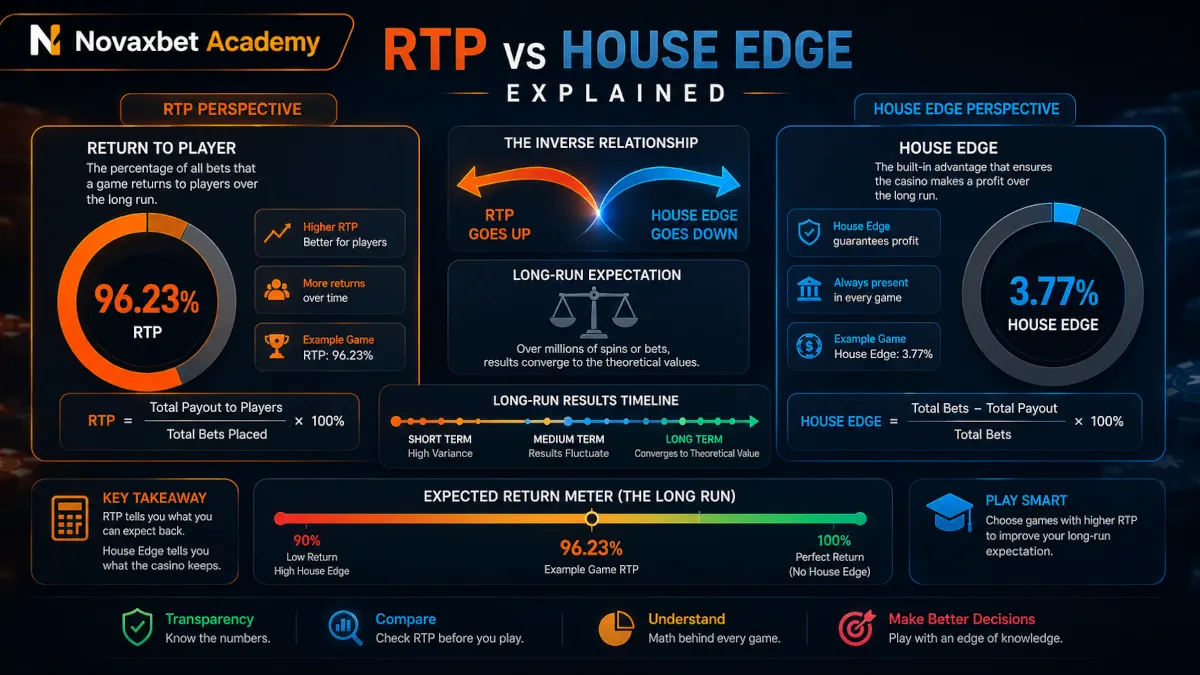
RTP vs House Edge Explained
Clear comparison between RTP and house edge, and how both metrics relate to long-term outcomes.
Novaxbet Editorial •2026-06-04•8 min read
RTP and house edge are two of the most repeated metrics in casino education, but they are often treated as if they were different realities. In fact, they describe the same long-run game math from two opposite viewpoints. If players, support teams, and content teams understand this relationship clearly, many common misunderstandings disappear.
This guide explains the difference between RTP and house edge, how both are calculated, what they mean in practical play, and what they do not guarantee in short sessions. It focuses on operational clarity, not promotional claims.
Core Definition: RTP and House Edge in One Line
Next reading
- RTP (Return to Player) is the percentage of wagered money a game is expected to return to players over the long run.
- House edge is the complementary percentage the operator is expected to retain over the long run.
Plain-text formula:
House Edge = 100% - RTPRTP = 100% - House Edge
If a slot has 96.0% RTP, its house edge is 4.0%. If a roulette variant has 2.7% house edge, its RTP is 97.3%.
So RTP and house edge are not conflicting numbers. They are two labels applied to the same expected-value structure.
Why Two Metrics Exist
Both metrics exist because different audiences think from different perspectives.
Player-Centric View (RTP)
Players usually ask: “How much can I expect back?” RTP answers that question directly in return terms.
- Higher RTP means lower expected long-run loss per unit wagered.
- RTP is intuitive for comparison across games.
Operator-Centric View (House Edge)
Operators and risk teams usually ask: “What is expected gross hold?” House edge answers this from the business side.
- Higher house edge means higher expected long-run retention per unit wagered.
- House edge links directly to margin modeling and revenue forecasting.
Both are valid. The underlying math is identical.
Expected Value: The Mathematical Foundation
RTP and house edge are summaries of expected value across very large numbers of rounds. A single round can be any valid outcome, but the distribution of outcomes has a predictable long-run average.
Expected value model (simplified):
- List all possible outcomes.
- Assign each outcome a probability.
- Assign each outcome a payout multiple.
- Multiply probability × payout for each outcome.
- Sum all products.
That sum is the long-run expected return per unit stake. Convert it to percentage and you have RTP. Subtract from 100% and you have house edge.
Simple Toy Example
Assume a game with one-unit stake and four outcomes:
| Outcome | Probability | Payout (including stake) | Contribution to RTP |
|---|---|---|---|
| Lose | 50% | 0.00 | 0.000 |
| Small win | 30% | 1.20 | 0.360 |
| Medium win | 15% | 2.00 | 0.300 |
| Big win | 5% | 5.00 | 0.250 |
Total expected return = 0.910 per 1.00 wagered. So RTP = 91.0% and house edge = 9.0%.
This does not mean every 100 bets returns exactly 91 units. It means the long-run average converges toward that level as sample size grows.
Long Run vs Short Session: The Most Important Distinction
Most confusion comes from mixing long-run expectation with short-run variance. RTP and house edge are long-run properties. Session results can differ heavily.
What RTP Does Tell You
- The average return tendency across many rounds.
- The expected loss rate per unit wagered in the long run.
- A fair way to compare structurally similar games.
What RTP Does Not Tell You
- What happens next spin, next hand, or next hour.
- Whether today will be a winning or losing session.
- When a bonus or jackpot will trigger.
Practical Example
Two players each bet 200 rounds on the same 96% RTP slot:
- Player A hits a bonus sequence early and ends +35%.
- Player B misses high-paying symbols and ends -48%.
Both outcomes are compatible with the same RTP model. Short samples are noisy. Long samples are more stable.
Relationship With Volatility
RTP answers “how much” in long-run return terms. Volatility answers “how bumpy” the path may be.
Two games can share equal RTP but feel very different.
| Game Profile | RTP | Volatility | Typical Experience |
|---|---|---|---|
| Slot A | 96% | Low | Frequent small wins, fewer deep swings |
| Slot B | 96% | High | Longer dry spells, occasional large wins |
Same expected long-run loss rate. Different session distribution and emotional experience.
When interpreting RTP, always pair it with volatility context. Without that, players may draw wrong conclusions about game behavior.
RTP Across Different Casino Categories
RTP is used across slots, RNG table games, and many live dealer products, but mechanics differ.
Slots
- RTP derived from symbol probabilities and paytable definitions.
- Bonus features can concentrate value in less frequent events.
- Different RTP versions may exist for the same title in different markets.
RNG Table Games
- RTP linked to rule set and bet type.
- In roulette, even-money bets and straight-up bets can share the same edge in standard formats.
- In blackjack-style games, RTP can depend on player decisions and strategy quality.
Live Casino
- Core game math often mirrors physical table rules.
- Platform fees or side bets can alter effective expected return.
- Pace and decision timing can affect bankroll trajectory even with similar edge.
The correct comparison is “same game family, same rules, same bet type, same RTP configuration.” Cross-category comparisons without normalization can mislead.
Common Misconceptions and Correct Interpretations
Misconception 1: “High RTP means I should win today.”
Correction: High RTP means lower expected loss rate over long volume, not guaranteed session profit.
Misconception 2: “After a losing streak, RTP must catch up.”
Correction: Outcomes are independent in compliant RNG systems. Past losses do not force short-term compensation.
Misconception 3: “House edge is separate from RTP.”
Correction: House edge is the complement of RTP. They are two expressions of one expected-value model.
Misconception 4: “RTP is fake because my result was different.”
Correction: Session results naturally diverge from expectation. Variance is not evidence of invalid math by itself.
Misconception 5: “All versions of a game share identical RTP.”
Correction: Different configurations can exist. Always verify the displayed RTP/rules for the exact version being played.
Step-by-Step: How to Read RTP Correctly as a Player
- Identify the exact game and version.
- Check the displayed RTP or paytable information.
- Translate RTP into house edge using
100 - RTP. - Estimate expected loss rate per wagered unit.
- Consider volatility before setting session size.
- Treat results as probabilistic, not deterministic.
Quick Conversion Examples
| RTP | House Edge | Expected Long-Run Loss per 100 Wagered |
|---|---|---|
| 98.0% | 2.0% | 2.0 |
| 96.5% | 3.5% | 3.5 |
| 95.0% | 5.0% | 5.0 |
| 92.0% | 8.0% | 8.0 |
This table is expectation, not prediction. Actual short-run path can be better or worse.
Operational Use Cases for Support and Product Teams
RTP and house edge are not just player-facing concepts. They are operationally important.
Support Teams
Useful for resolving tickets like:
- “Game is not paying as advertised.”
- “I lost 20 rounds, so something is wrong.”
- “RTP says 96%, why did I lose more?”
Support responses should:
- Explain long-run expectation clearly.
- Avoid implying guaranteed outcomes.
- Reference game rules and RTP display location.
- Escalate only when logs suggest technical anomaly.
Product and Content Teams
Useful for:
- Building educational guides with correct terminology.
- Avoiding misleading phrasing around “best games.”
- Structuring comparison pages by normalized criteria.
Recommended publishing standard:
- Show both RTP and house edge together.
- Include a short variance disclaimer.
- Separate expected return from volatility behavior.
Finance and Analytics Teams
Useful for:
- Hold forecasting at portfolio level.
- Mix analysis by game category.
- Sensitivity modeling when RTP configurations change.
At aggregate scale, observed hold should trend around expected house edge, with deviations caused by sample size, mix shifts, and jackpot timing.
Risk Boundaries and Limitations
RTP is a useful metric, but not complete on its own.
Key limitations:
- It does not capture bankroll risk path.
- It does not rank entertainment preference.
- It does not remove outcome uncertainty.
- It may vary by jurisdictional configuration.
- It does not substitute for responsible play limits.
Interpret RTP as one component in a broader decision framework:
- expected cost,
- volatility profile,
- session duration,
- personal risk tolerance,
- responsible gaming controls.
Closing Synthesis
RTP and house edge are mathematically complementary, not competing concepts. RTP expresses expected return from player perspective. House edge expresses expected retention from operator perspective.
The correct mental model is long-run expectation plus short-run variance. When this distinction is clear, players avoid false certainty, support teams communicate more accurately, and product content remains technically consistent.
In practice, good interpretation means:
- compare like-for-like game versions,
- convert RTP and edge fluidly,
- include volatility context,
- treat session outcomes as probabilistic.
That approach turns a confusing metric into a reliable framework for understanding casino game math.